Solar, wind, and other renewable energy sources (including biomass, geothermal, and hydropower) added more than 2,250 MW of new generating capacity each month during 2021.
That was according to the SUN DAY Campaign, which based its finding on data from both the Federal Energy Regulatory Commission (FERC) and the Energy Information Administration (EIA).
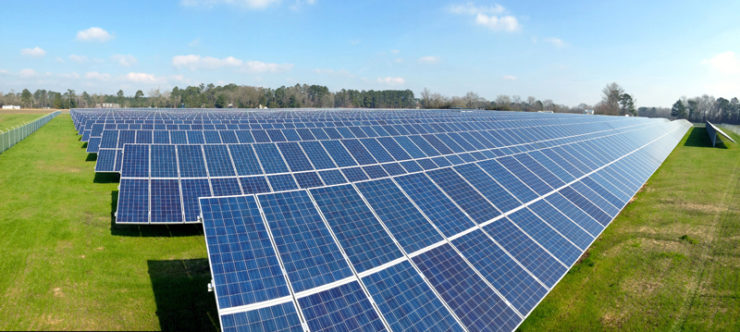
The report said that according to the FERC’s “Energy Infrastructure Update” (with data through October 31), utility-scale renewable facilities at least 1 MW in size added 18,255 MW of new generating capacity during the first 10 months of 2021.
Separately, the EIA’s most recent “Short-Term Energy Outlook” forecasted that small-scale distributed solar less than 1 MW in size was on track to grow by about 5,100 MW in 2021. Both figures led SUN DAY to conclude that utility-scale renewables plus distributed solar were adding more than 2,250 MW of new capacity each month.
In December, the Solar Energy Industries Association (SEIA) and Wood Mackenzie said that trade policy uncertainty and supply chain constraints were driving solar price increases across all market segments. They warned that logistical challenges and price increases in the solar supply chain would likely depress deployment over the next year, resulting in a 7.4 GW (25%) drop in the forecast for 2022 compared to previous forecasts.
The industry trade group’s analysis said that solar projects would continue to face supply chain challenges in the near term. It added that clean energy provisions in the Build Back Better Act would stimulate solar market growth and avert the expected slowdown.
Days after the SEIA outlook was released, Sen. Joe Manchin (D-WV) publicly announced his opposition to Build Back Better, drawing White House ire and prompting the United Mine Workers of America, among others, to urge the senator to reconsider his opposition.
According to the SUN DAY Campaign’s analysis, during the first 10 months of 2021, solar and wind added 9,604 MW and 8,580 MW of capacity, respectively. Including new hydropower (28 MW), geothermal (25 MW), and biomass (18 MW), renewables provided 83.6% of all new generating capacity through the end of October. Natural gas capacity grew by 3,549 MW and new oil and coal capacity increased by 19 MW and 11 MW respectively. No new nuclear capacity additions were tallied in 2021.
- Chamisa under fire over US$120K donation
- Mavhunga puts DeMbare into Chibuku quarterfinals
- Pension funds bet on Cabora Bassa oilfields
- Councils defy govt fire tender directive
Keep Reading
Renewable installed generating capacity now stands at 25.47%. That is up from 23.31% a year ago and 18.58% in 2016, SUN DAY said.
It said that growth was “almost entirely attributable” to a nearly three-fold increase in wind’s share of installed generating capacity and a 35-fold increase in solar’s share. Wind is now more than 10.54% of the nation’s generating capacity, up from 3.80% in October 2011. Utility-scale solar now accounts for 5.21% of total installed capacity, not counting small-scale distributed solar.
During the first 10 months of 2021, solar and wind have each set new records for capacity additions. SUN DAY said. The 9,604 MW of new solar through October exceeded the 6,516-MW added during the same time period in 2020, or the 3,758 MW added in 2019. Likewise, the 8,580 MW of new wind capacity exceeded the 7,161 MW reported for 2020, or the 4,721 MW added in 2019.
According to the EIA’s “Electric Power Monthly” report, utility-scale solar and wind generation during the first 10 months of 2021 rose by 27.9% and 11.1% respectively compared to the same period in 2020. Wind now accounts for 8.64% of US electrical production while solar — including small-scale — is providing 4.08%, SUN DAY said.
Solar and wind both are on track to continue growing through 2024. FERC said that there may be as much as 170,941 MW of new solar capacity in the pipeline with 52,692 MW classified as “high probability additions.” That was offset by around 92 MW of projected retirements.
A year ago, FERC reported 128,001-MW of solar in the three-year pipeline with 32,784-MW classified as “high probability.” In addition, new wind capacity by October 2024 could total 71,929 MW with 23,180 MW being “high probability” with around 150MW of retirements expected.
“High probability” generation capacity additions for utility-scale solar and wind combined, minus anticipated retirements, reflect a projected net increase of 75,630-MW, SUN DAY said in its analysis. Its figure does not include new distributed, small-scale solar capacity or additions by hydropower, geothermal, and biomass. By comparison, net growth for natural gas will be around 14,327 MW.
The SUN DAY analysis said that if just FERC’s latest “high probability” projections materialise, by October 2024 renewable energy sources should account for more than 30% of the nation’s total available installed generating capacity. Utility-scale solar and wind would account for 9% and 11.81% respectively. — Renewable Energy World